To begin to draw a map of your ancestor’s land similar to the sketches made by the surveyors, you first need to understand the “code”.
Let’s use an example: S 30 E 74 poles. There are 3 pieces of information here.
- The 2 letters indicate the direction. In this example, we will be measuring a line SE from a location. If only 1 letter is given, then the direction is directly North, South, East or West. For example: E 17 poles will be a line drawn directly east.
- The number between the 2 letters indicates a number of degrees. So we will be drawing a line that is 30o in the SE direction.
- The final number gives the length. 74 poles.
1 pole represents 16.5 feet, but for easy measuring, I made 1 pole equal to 1 mm on my ruler. (Millimeters are the tiniest marks on the metric ruler. The numbers are for centimeters.)
When measuring the direction of your line, it is important to know that there are 2 locations for zero degrees – directly North and directly South. As you move toward the East or the West, the numbers get larger until you reach 90o.
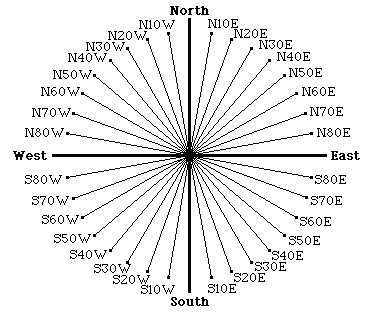
You can measure your degrees with a regular protractor from the school supply section of your local store. Measuring is much easier if you have a round protractor, which you can pick up at most office supply stores, but even those can be confusing because they are made to measure a full 360o going clockwise OR counterclockwise, so there are 2 different scales and you must be sure to use the correct one.
Because textbooks don’t lie flat, I’ve always made copies of the circular protractors on flexible, overhead transparency material that my students cut out and use to measure bearings in Geometry class. Because they are transparent, it’s easier to make sure you are lining things up correctly. So I used PhotoShop to create my own “surveying compass” that had only the necessary compass readings for the metes and bounds and I plan to copy it onto transparency material. You can use the paper version as long as you hole punch the center of the to make sure that the point you are measuring from lines up correctly. Since most people won’t have access to overhead projector film, I’ll make my illustrations with the paper version.
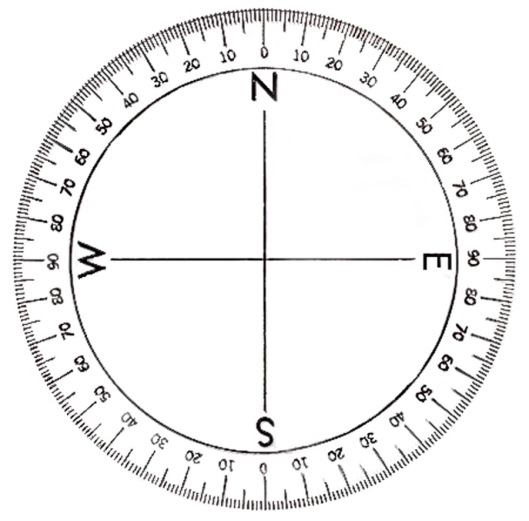
To draw your map:
- It would be nice if every surveyor measured the property in a clockwise direction starting in the NE corner, or something like that, but they didn’t. Until you get the hang of reading these codes, it can be difficult to know where to begin on your sheet of paper. All I can say is that eventually, you’ll be able to read through the measurements and make a super quick sketch to at least see which direction they moved while measuring.
- Choose a point to begin your map. You map will be similar to a dot-to-dot diagram, but you will not know where the next dot belongs until you draw a line.
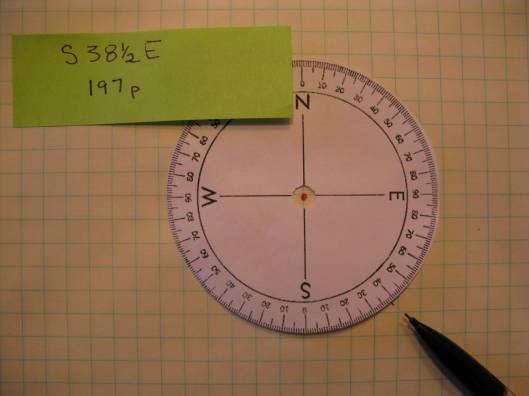
- Lay the protractor center on the dot that will be your beginning. Make sure that “N” is pointed straight up. (Using graph paper makes this much easier.)
- Use the letters in “the code” to know which quarter of the protractor you’ll be using. Make a small mark that lines up with the number of degrees which appears between the 2 letters.

- Using the metric side of your ruler, line up the 2 dots that you have made. Measure from the original dot the number of millimeters that appears at the end of “the code”. (You can barely see my little pencil mark across from the #4 on the ruler in the next photo.) I write the code along this line so I can make sure I don’t skip any.

- The end of your line becomes the dot that goes in the middle of your compass for the next section of your boundary description.

- Continue around until you get back to the beginning.
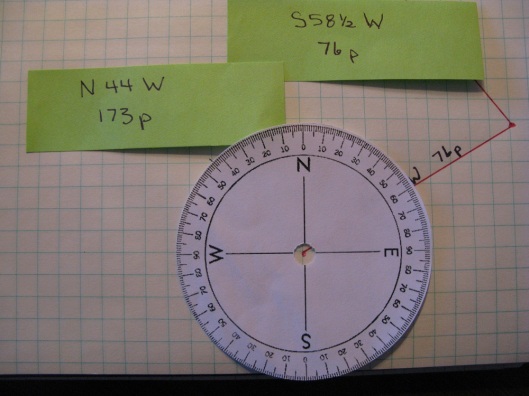
MOST of the maps that I’ve completed with this method have come right back to the original dot that I had made. But on a couple of them, they do not. I have to believe that dragging chains up and down hills and around trees had to make these surveys less than perfect and after double checking my measurements, I chose to fudge my drawings just a bit when this happens to make them align – but I make a note that I’ve done that.
As I go through the deed, I also add information like owners of neighboring properties or landmarks that could still be around today – like river banks or creeks. Those creeks are what have allowed me to pinpoint my ancestor’s location on maps. I can also convert those poles into feet or miles to help me have a better idea of the size of my ancestor’s property.
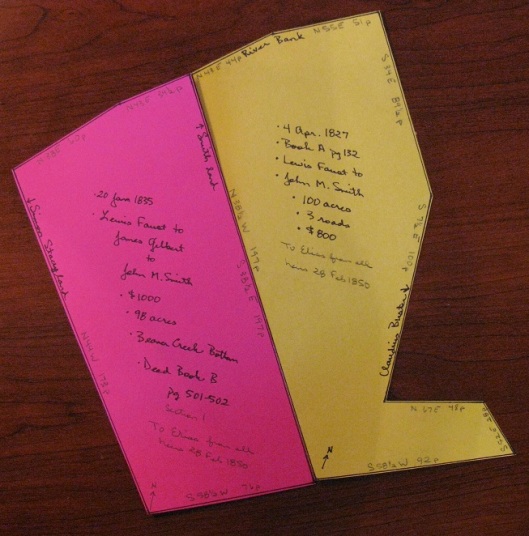
After I complete the graph paper version, I cut it out and transfer it to cardstock and write all of the information that I know about the piece of property.
As I’m working my way through various deeds, I’m discovering neighbors and even can see a pattern of how my ancestor expanded his property. For example, after completing my maps from two different deeds, I found that the pieces of land were connected to each other. Something I never would have figured out without paying attention to the details found in that frustrating metes and bounds code!
If you are researching in Kentucky and are looking for some highly detailed county maps, this web site has great maps from 1950 and 1999.
My husband says you have to be a real math geek to spend a Saturday afternoon with a protractor drawing maps like this, but I’ll let you be the judge of that!


If you qualify as a math geek, then count me a genealogist geek – both of which I’m glad for! Thanks for going through this process. I’m going to email you for a copy of your compass so I can give this a try myself!
Truly an excellent post – great graphics and instructions.
Thanks — Randy
This is absolutely brilliant – clear, small words (for those of us who are not math geeks), and enough pictures to make even the most petrified history major feel she could manage to plot one deed. Blessings on you for taking the time to put this together. Email is on the way!
Thank you, thank you for such a clear description of the process. I took a workshop at a conference a number of years ago but have completely forgotten all I learned. Now I can try again.
I was just transcribing some New Jersey deeds last night, thinking “I really should plat this”. Your post will help me do that. Thanks so much.
Do you know anything about links and chains? I found these measurements in an early Wisconsin Deed. Do they use chains and links only for survey?
I know that a “chain” is made up of 100 “links” and that 1 link was equal to 7.92 inches. So doing a little math tells me that a chain would be 792 inches which is exactly 66 feet. You can see a picture of one on Wikipedia at http://en.wikipedia.org/wiki/Gunter's_chain or do a Google Images search for Gunter’s Chain.
Hope that helps!
Lisa
Fabulous! This is so much better than my plotting scheme that may or may not end back at the original dot! Many of my ancestors have open plots!!!!! LOL.
I would love a copy so I can practice, emailing you now!
Thanks.
Brilliant. You’ll be hearing from me soon!
Thank you very much. Your step-by-step process makes it simple to follow along. I can’t wait to try with my Kentucky land records.
Just excellent! A run-through following your instructions will prepare researchers to use even simple computer mapping programs – which usually do not explain the parameters nearly as well. Kudos 😀
This is the best description I have ever seen for this process. Thank you for the tool, which I can print out for myself. In this age of computers, the few overhead sheets I have left couldn’t be put to better use!
Pingback: Make A Compass | Mucugi
Pingback: A Good Deed for the Day | Roots2Branches Network
Pingback: Tracking Land Records | The Shy Genealogist
Pingback: Oh Those Land Records! | The Shy Genealogist